You are here: Building the Model: Advanced Elements > Variables > Variable Edit Table
This edit table is used to define Variables used globally in the model. A description of each field is given below.

Icon This field shows "Yes" if an icon for the variable appears on the layout. A variable’s icon looks like a counter and displays the variable’s value.
ID The variable’s name.
Type The type of variable, real or integer.
Initial Value The initial value of the variable to be assigned at the start of the simulation. By default, initial values are 0, but can be changed in the edit table to whatever value you want. Any expression can be entered here (including previously defined variables) except attributes and system functions.
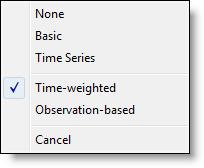
Stats ProModel collects statistics for each variable on three levels of detail, None, Basic, and Time Series.
• None No statistics are collected for this variable during simulation.
• Basic Collects basic statistics such as total changes, average minutes per change, current value, and average value.
• Time Series Collects all the basic statistics plus the value history based on time or observations. When you select Time Series, ProModel collects either time-weighted or observation-based statistics for the variable depending upon the type selected.

|
Variable Observation Record |
Value |
Time in Hours |
|---|---|---|
|
Observation 1 Observation 2 Observation 3 Observation 4 |
6 5 6 5 |
1 2 3 4 |
|
Total |
22 |
10 |
Time-Weighted Collects information on the percentage of time the variable was at a specific value. As shown in the above table, the average value of the variable is:
(6 x 1) + (6 x 3) + (5 x 2) + (5 x 4) = 5.4
10
Observation-Based Collects information on the number of times the variable changed to a specific value. As shown in the above table, the value of the variable is 6, then 5, then 6, then 5. The average would simply be:
6 + 5 + 6 + 5 = 5.5
4
Notes A general notes field for describing the variable. Click on the Notes button or double click in the field to open an edit window for entering detailed notes.
Please note
In order to create plots or histograms for a variable, Time Series stats must be selected in the variables edit table.